Showing posts with label Market Analaysis Piyasa Analizi borsa sp500 Amerika US. Show all posts

Sunday, November 18, 2012

18/11/2012 Market review

Sp index fell around 8%from the highs after breaking the post QE3 and previous break out level  around 1420-1430 to the downside.

Below is the sp future daily chart.The market found support around 1340, and put in a reversal candle for the moment.Of course it needs confirmation on the next session to set a potential short term bottom.

Below is the sp weekly chart.Check the MACD divergence where as the market made a new high, MACD made a lower high , which is a typical sign of exhaustion of the uptrend.


To summarize, it looks like for the very short term, the market is likely to bounce , but for the longer term, the bullish trend had a major blow. Weekly chart is signaling that further weakness in the coming months is more probable than the continuation of the uptrend. With fiscal cliff stories in the headlines, this scenario makes sense.

I bought APPLE around 525 for the short term with the idea of taking advantage from a bounce from key support and oversold conditions.Friday saw the biggest volume in couple of months, which strengthens the probability of a relief rally.


Also long the GOLD .It broke out of the triangle post QE3.  Many analysts point to a cup and handle formation with the recent weakness, which if realizes will take the GOLD above the previous highs. But for that 1800 level has to be taken first.


Opened a small short position in the Turkish stock exchange as the market is hovering around all time highs, with impressive around 30% rally from June 12. The market closed on the lows for the week , closing below key 71000 level where the spike up to 73300 happened on the day of a rating hike from Fitch.The latest leg of the rally resulted from the expectations of the rate hike,but the market is struggling to go further up. It looks like to me a good probability trade of the old " buy the rumor sell the news" strategy.Note the MACD divergence here as well.


Thursday, July 19, 2012

19/07/2012 Market review

Markets are pushing higher with better than expected earnings, and relief resulting from the strong message of European Politicians concerning the steps that are going to be taken to solve the ongoing crisis.

Sp index is trading around 1375, there is a strong resistance around this level, and the next level would be the year high 1422.

Gold is still in the triangle mentioned last week. But the breakout is coming soon with the trading range getting tighter and tighter.


Friday, June 15, 2012

15/06/2012 Market Review

Sp index went down to 1266 during the past month before bouncing back above 1300 last week.At the moment the future is trading at 1337.5 indicating index levels around  1333.

Below is the daily sp index chart. As you can see the market bounced slightly below the 200 day MA(yellow line).


To see the complete market action, most of the time it is useful to look at the daily sp future chart as it trades continuously except weekends.When the news came about the Spanish bailout over the weekend, the future spiked to 1349 , then fell till 1306 on Monday the 11th of June,eventually bouncing from 1303.5. You can see that the spike took the market up to 50 day MA(orange line), failed to hold at that level and bounced back again from 20 day MA(green line).


Below is the weekly chart of sp500.50 week MA(orange line) is where the market found support.


And finally lets check the daily Gold graph.The triangle formation is still in action.The market is testing the upper leg. Even if that leg is broken, there are significant resistances above ,namely 1670 and 1700.It looks like that the market is waiting for the realization of quantitative easing of some sort, or a real panic in the markets to make new highs.Nevertheless, small long position there.


The Greek elections this weekend has been bothering the markets together with the rising Spanish and Italian bond yields. Worse than expected macro economic data from US is adding to the pressure. Despite all these, it looks like the increasing expectation of a quantitative easing 3, or a similar action from FED and the belief that the European politicians will do whatever necessary to support the Euro is keeping the markets relatively strong.

Friday, May 18, 2012

18/05/2012 Market review


Sp future indicates index levels around 1306, 11 points higher than the after hours low.The markets in Europe have been edging lower during the past weeks but sp was holding above 1340 level. This week that support is broken and hence the strong selling in the past few days took the market lower.

Below is the daily sp index chart. The white trend line is broken at the matching point of previous significant high around 1370, and the selling accelerated.To the downside the major supports are 1293-1300 range, and below those is the 200 day Ma around 1278(yellow line).Upside, 1340 is now the first resistance, then 1370, and higher than that is the latest high around 1422.


In the weekly chart below you can see that 20 week MA is broken and 50 week and 80 week Ma's are the next supports ,1282 and 1286 namely.To the upside 20 week Ma is at the moment around 1257.


One thing to mention, gold is around 6 %lower compared to past month so, in real dollar terms sp index is still around the 1 year highs. I believe this shows that the markets are not in a panic mode yet , but the macro economic fundamentals are adjusting themselves to the current conditions.Still if you look at the chart below which is the weekly sp/gold chart, there are few reversal candles in place, but the index has a support of 20 week MA which is very close to current levels.


However, in Europe the story is different.  The policymakers havent responded yet to the markets'  demand for some relief concerning the debt crisis, and Greece is not helping the situation as well. The famous "Sell in May , Go Away!" slogan is definitely putting some pressure on the markets too.

Below is the gold daily chart: There is an assymetrical triangle formation in the daily chart with many of the major mid term support averages broken down. I got some long position around these levels for the long term again. But would not be surprised if the Gold would go further down as will be shown in the next graphs.


Below is the weekly chart of the gold. The 20 week Ma(green line) is acting as a resistance together with the 50 week MA(orange line) since both has been broken for the first time since late 2008.At that time the market had not started the big rally in the past 3 years, but still the market bounced close to 200 week MA(yellow line), which stands around 1248 at the moment.


Now if we check the gold graph in the monthly chart below, you can see the correction in 2008 bounced from the 50 month Ma(orange line) which stands around 1232 at the moment. In the monthly chart , the bull run of the gold is more obvious, and I think it is quite likely that the market to make new lows below 1520 , break the triangle in the daily chart to the downside, but bounce somewhere above 200 week/50 month MA.


All these being said, as mentioned before, I opened a small long position into Gold, keeping in mind a possible big down move, and adjusting my size accordingly. It looks like Gold is waiting for QE3 from US for the next leg up, together with a panic in financial markets .

Concerning the stock market, I would consider a bounce to the upside as a shorting opportunity, and to get long I am waiting for  some sort of action to relax the uncertainty in the credit markets in Europe.


Friday, April 20, 2012

Market review 10.04.2012

Sp future points to index levels around 1380 at the moment. It is almost 2 percent down from past month. The index made a brief high at 1422 before going down to as much as 1357. Meanwhile major European indices all are down around 10% from the highs with renewed concerns about the debt crisis. Gold is trading mostly sideways.

The daily sp index chart is below:


The index is trading around the breakout level (1370), but to the upside 20 day MA is the resistance at the moment around 1393.To the downside, 1357, 1340 and 1293 are significant levels with major support 200 day MA around 1273.

The weekly chart is as follows:


20 week Ma is around 1335 and 50 week around 1279.

To sum up, the bearish pressure built up once again in European markets, but the US equity markets are holding strong so far with earnings mostly better than expected. We will see which market will follow the other.

It seems to me that once again the European Markets are demanding for more easing in some sort from ECB to overcome the bearish pressure.

The long term indicator I use is flat, with mid term being still positive. Short term is negative.

Friday, March 16, 2012

16/03/2012 Market review

Sp index is trading around 1403, but considering the latest correction in Gold and with the up move in SP, the past month's rally from 1358 is more than 3% in real dollar terms.(spindex/gold went up roughly from 0.77 to .847 which is 10%!!)

Below is the daily chart in the sp index:
The market briefly went down the 20 day MA for the first time and without even touching 50 day MA, it bounced sharply.The first obvious support is 1370 level, the second being 1340, the low of the latest minor correction and 50 day MA(orange line) at the moment.

The weekly graph:
The decisive break through  is more obvious in this chart.

I am carefully watching the correction in the Gold, taking part of the profits past month was a good decision, definitely going to be a buyer around 1520-1550. It has the potential to go much lower as posted before(more quantitative easing is not likely for the coming months, and positive sentiment in the market is also a downside pressure), so size management is crucial for the long run.Short position in Aex costed some , locked in part of it in the correction but still kept more than half of the position.

Market indicators I am using:

short term(2-4 weeks): 0.717
mid term  (1-6 months):  3.324
long term  (6 months-) : 0.306

The long term indicator is flat.
The mid term shows strong uptrend is likely to be intact for the coming months,
and the short term shows the upmove is likely to take the market higher in the coming 1-2 weeks before a significant correction.

Friday, February 17, 2012

17/02/2012 Market review

The trend since late december continues, every down move is immediately bought. ECB's second round of longer term refinancing operation (LTRO)  on 29th february , the expectation of QE3 and the improved economic indicators in the US are the main drivers of the rally. The earning results  in Europe were a little disappointing but in the US ,they were better than expected for most of the companies. Major indices are taking year(some multi year) highs one by one.Overall, everything looks very good. That being said , i opened a small short position in Aex, and bought some out of the money puts because I still believe this rally is extremely  fragile ,the option premium is not that expensive and resistances are not broken decisively yet.

Below is the daily sp chart:


As you can see the market has been above 20 day MA(green line) after breaking the 200 day MA to the upside around 1250 at the end of December.1st support around 1333, and 2nd Major support around 1290.(50 day MA, orange line), and the 3rd major support 1255(200 day MA).

Next lets check the weekly graph:


Gold hit the resistance around 1750 and in a sideway action for the moment. I sold part of the position to lock in some profit, because I believe there is quite a good chance that the Gold will test 1520 level again, and even further down before breaking the alltime highs.

Overall, except my small short position in the index and long term long Gold position, the market is a wait and see for me.

Friday, January 20, 2012

20/01/2012 Market review

I shorted the market last month around 200 day Moving average. It did not work.The gold bounced back from the lows, that was the good trade for the past period.

Below is the daily chart of sp. The market is going up since mid december without a decent pullback. First support is the green line ,20 day ma around 1275 and the major support is the yellow line, 200 day MA around 1257.


Looking to the weekly chart below, the  supports below 200 day MA are the 80 week MA(blue line) 1235 and the 20 week MA(green line) 1227.


To summarize, the current market is a wait and see for me. Looking at the price action,it seems that the market turbulance during the summer and early autumn was just a correction in the bull market and the market is quite likely to make new highs, but I just dont believe it, thus i dont bet on it.


Friday, December 16, 2011

16/12/2011 Market Analysis


The market is kind of in a range, 200 day Moving average (yellow line ) setting the upside resistance for now.200 week Ma(yellow line in the weekly chart) is roughly setting downside support for now.
Nothing much to mention. A decisive break to the upside looks unlikely, and the momentum indicators are converging all to the sell side. Below is the daily and weekly graphs of sp daily index.

daily graph:


weekly graph:


Finally i bought more gold for the long term, and now i m watching the market action, to get out gradually in case the sell off continues below 1520s.Below is the weekly graph of gold:


The coming month , I will be watching the indicators closely to short the index.Happy holidays!

Friday, November 18, 2011

Market review 18/11/2011

I am still long the gold for the real long term, other than that, as planned last month  i was short some calls when sp was trading around 200 day MA, but now i covered them as the market getting close to the support, and european indices are trading around 50 day moving average although the short term momentum is still down.

Lets have a look at the charts. Check the sp index daily graph below:
As you can see, sp index traded 1296 when the news of an aggrement among eurozone leaders hit the market and european shares traded around 5 % higher for the day. After then, there have been quite some sessions where 20 day moving average acted as support and 200 day moving average was the resistance. The markets will probably test 50 day MA soon which is around 1205.

The weekly chart is below:
Both 50 week and 20 week MAs are flat, indicating a sideways priceaction for now, 50 week MA as the resistance for now around 1270. Weekly momentum is still bullish.

BAsed on the current price action, I am looking to get long only when the daily  momentum turns bullish.When i check the indicators, it doesnt look likely soon, maybe next week, but 200 day MA resistance sits tight around 1270, so the upside is limited for now. That being the case, I am waiting for an upmove, to short the market once again close to the 200 day MA.

Friday, October 21, 2011

21/10/2011 Market review

Concerning the trades I was looking for past month, i m just in gold for long term. Other than that did nothing positionwise.The markets are extremely choppy and waiting for very high probability trades.


First lets check the daily graph below:
Sp future is around 1221 at the moment. There is a strong resistance around 1233. 200 day Ma is aroudn 1274, thats the level I am looking for. The indicators overall show strength for the short term. So i still dont like 1230s as a level to short.To get long, there has to be a decent pullback to 1170-1180s where 20 day and 50 day MAs are. 50 day Ma is turning upwards, which is another pro for short term up bias.
.
The Weekly graph below shows that the market is trading around 20 week MA which is around 1226, the next level is 1250s and 1266 , 50 week MA. You can see that 50 week MA is flat, which means mid term up trend(2-3 year)  is at least in a pause and 20 week Crossed below 50 week MA. Bollinger lines are flat, indicating a range for now.If you look at the Macd(the indicator below the volume),histograms are back to neutral, and turn positive in case we dont see a sell off next week.Stoch is on the oversold levels as well. 


Finally below is the monthly chart. The MACD in the lower side of the chart shows a possible break down , possible enterance to a bear market whereas the candle made during the price action of past month shows a reversal. Which one is true?Time will tell.


 As you see, a lot of conflicting signs, mid term range vs short term up vs very long term bear market? 

Basically, this month trades I might be looking for are try long on 50 day MA for sp, short around 200 day MA, might buy more Gold if it goes back to 1530-1550, of course all depending on the market action at the time .I dont follow eur/chf that much becuase of the snb intervention to the markets. 

Friday, September 16, 2011

16/09/2011 Market review

The market had a bounce , sold off again, made new lows in dax, and bounced sharply once more. On the right hand side is the sp daily chart:
The market had a rally till 1231, and sold back to 1130 and now trading around 1200 again. I sold my longs and now I am looking for 1231 level, 50 day MA to short the market. I have the feeling of a big rally coming up so, I dont really believe 50 day MA will work but with a tight stop it is worth trading. I have a better feeling of 1283, the 200 day MA.
On the right is the weekly chart:You can see the 50 week Ma is still with a positive slope. 20 week and 50 week are intersecting around 1265 which is another resistance before 200 day MA.Finally i would like to point out sth interesting in the monthly chart below:
Look at the orange circles in stoch and MACD.Stoch already broke down,and MACD is testing to break down which means the uptrend lost its power significantly and if the market does not show some power up soon, it is very likely that we enter the bear market. Look how the previous break ups/downs mark the reversal points.
Next is the dax daily graph:See how the moves in the past couple of weeks was in a downward sloping channel-flag. When the market breaks this channel, up or down, we will most probably see a strong move! At the moment, upper side of the channel is being tested, and this is another reason I dont like the 50 day MA at 1231 as a selling point. It is just not that strong.
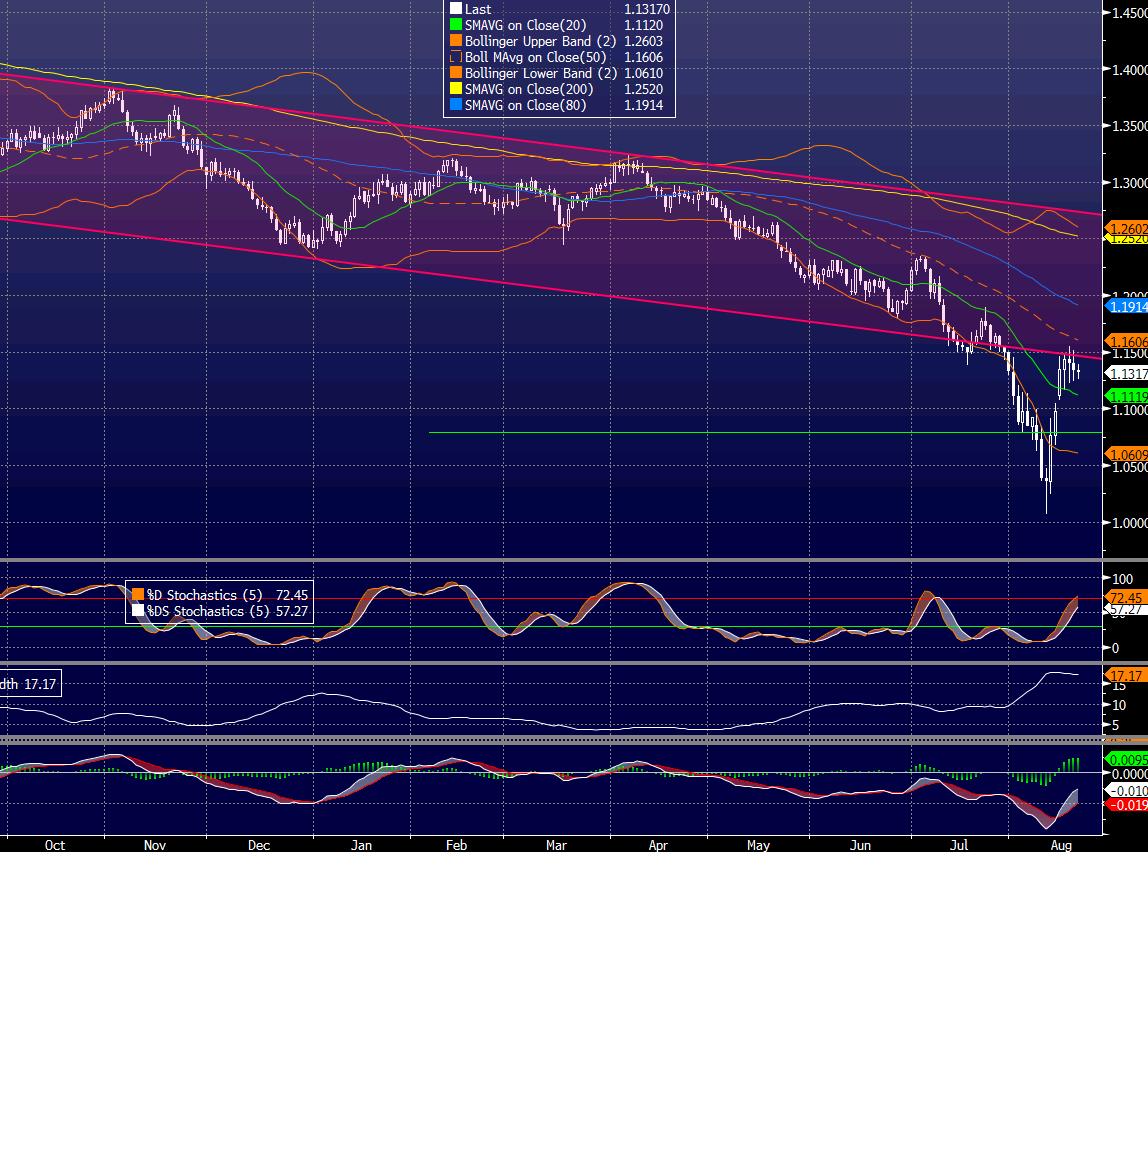
Here is the eur chf daily chart:As mentioned in the previous past, there were some crazy moments during the past month when eur chf spike from 1.10 to 1.21 in a matter of time due to SNB announcment of doing WHATEVER IT TAKES to keep eur chf at least at 1.20! Well I wait for 200 day MA to short it as I said last time. DId nothing so far.
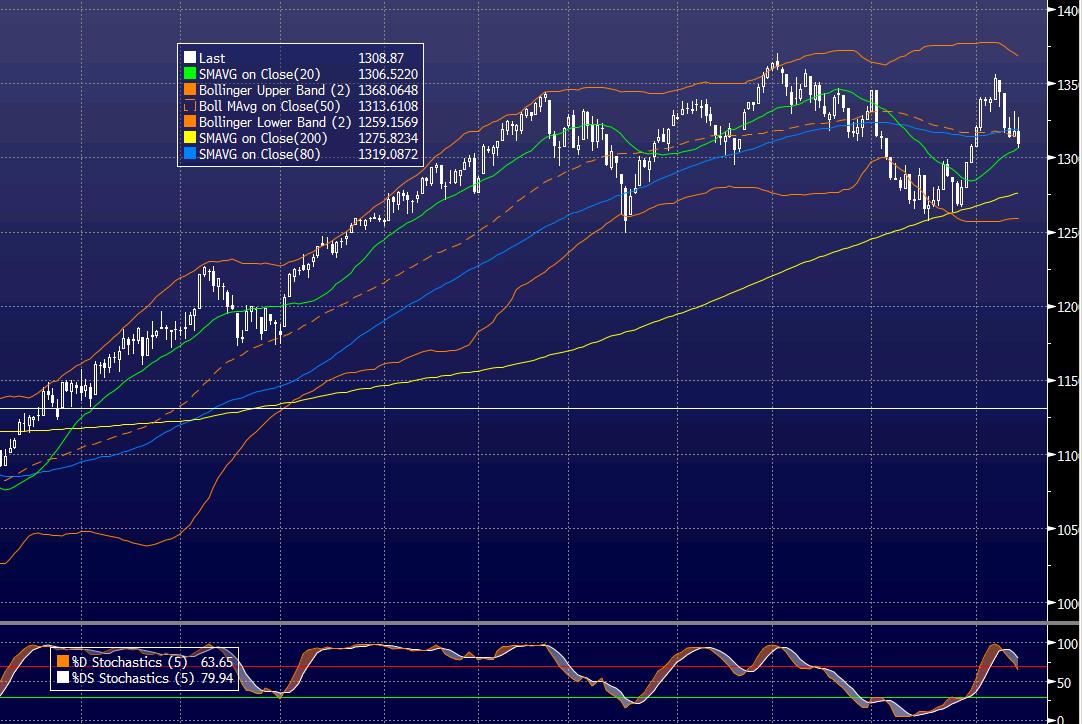
On the right is the gold day chart:I have been looking to enter the gold around 200 day MA(yellow line), which has been the major support during the past 2 years but looks like gold might not see those levels for a long time.50 day Ma (orange line) intersects the breakout from the channel, seems to be a good point to get long for the long term around 1730. And if we see a bigger sell off 200 day MA is still there around 1516. I start buying slowly around these levels.
Mittal has been one of the stocks sharply sold off during the past months. It is almost on all time lows, so I got long aroun 12.5. My target is around 15. 50 day Ma is around 17, and the market is testing the 20 day Ma to the upsite around current levels. Of course it all depends on the broad market.All around in the daily charts there are bullish divergences on MACD, so i see the probability quite high for a quick rally.


Last month I was looking for the following trades:

sell eur/chf around 200 day MA(1.25 at the moment) :Target is 20 day MA.Stop should be wider than usual, because of the possible volatility after such a move. SO size of the trade should not be too big. I dont see eur/chf going those levels that fast, but you never know what SNB will do to "normalize" the franc.

INDEED SNB INTERVENED THE MARKETS DID NOTHING SO FAR.

buy index future:sp index support 1100. I am long small index position around sp 1120, with sp support around 1100. I will buy around 1100 if the market sell of continues, and I will scale out if the support is broken.I still have some extra puts left , so I am covered to some extent.Target 1208!

WORKED FINE!

sell index future:.: Mainly 200 day MA, around 1285. .I will probably sell 20 day and 50 day MA's with tight stops, depending on the situation at the time.

COULD NOT SELL!

 This month I am looking for the following trades:

BUY small gold position around current levels, increase the size if the sell off continues, reduce if 200 day MA broken (1520) for the real long term! (Already bought 1770)

 SELL index future:.: Mainly 200 day MA, around 1283...I will probably sell 50 day MA' with tight stop around 1231 depending on the situation at the time.

 SELL eur/chf around 200 day MA(1.2369 at the moment), BE READY FOR EXTREME VOLATILITY , keep the size of the trade managable.

 BUY index future/STOCKS:in case market goes close 1100 level. major support..

Friday, August 19, 2011

Market review 19/08/2011

The markets sold off sharply and today we saw new lows in dax.To be honest,expecting the down move even I was caught a little off guard with the speed of the sell of. But , I had my protection for couple of months, the 1 by 5 put ratio , which worked perfectly as a hedge to the stocks, turbos i bought on supports. Is it early to call that we are officially in the bear market? We will see. Fed can pull out the qe 3 , just like last year, to support the markets.Lets first check what happened:

Below is the SP weekly chart. Well, none of the supports I mentioned hold, namely 80 week MA around 1208(blue line), and 200 week Ma yellow line around 1160. The market sold till 1100, with around 1077 the low in the future during the pre-open phase.Then we had couple of crazy sessions with 5% up , 4% down, again 4% up...Well, market is being sold heavily again during the past two days, using 80 week MA as the resistance.


The day chart is below:The first major resistance is 1208 , 80 week ma, blue line, where the market reversed 2 days ago.I have been looking at the 80 week MA as the support for the bull market for the past 2 years, well the reversal of the market from that level might be a sign that we are indeed in the bear market. The picture will be clear in few weeks. I will be watching 20 day(1230 at the moment) and more importantly 200 day MA(1285 at the moment) to short the market.


Now, the eurchf. As mentioned in my previous post i tried to get long on the lows when tested 2 nd time around 1, 08. But immediately closed the positions when new lows were made. Psychological 1 level holded, but never saw the level again to get long. There were rumours about pegging the franc with Eur, which helped a 15 % rally.Thats the reason I did not sell into 20 day MA. It was a completely new situation Below you can see the daily chart, the market is testing the breakdown of the long term down channel. Actually, I am quite resistant to short it till these rumours with SNB are more clear. 1.16 is the 50 day MA, where the previous down move happened, it might be a good level. If there is some kind of a spike due to a rumour, i will definitely try shorting around 1.25, 200 day MA.


Last month trades I was looking for:

eur/chf: buy 1.08 with a tight stop did not work Stopped immediately.
sell into ma20: did not due to unknown market conditions.

This month:

sell eur/chf around 200 day MA(1.25 at the moment) :Target is 20 day MA.Stop should be wider than usual, because of the possible volatility after such a move. SO size of the trade should not be too big. I dont see eur/chf going those levels that fast, but you never know what SNB will do to "normalize" the franc.

buy index future:sp index support 1100. I am long small index position around sp 1120, with sp support around 1100. I will buy around 1100 if the market sell of continues, and I will scale out if the support is broken.I still have some extra puts left , so I am covered to some extent.Target 1208!

sell index future:.: Mainly 200 day MA, around 1285. .I will probably sell 20 day and 50 day MA's with tight stops, depending on the situation at the time.

Wednesday, August 3, 2011

S&P and EUR/CHF update

Below is the sp index weekly graph. The market is testing the march 2011 lows around 1250. The future bounced from that level and up half a percent for the day at the moment. In the bigger picture , the 80 week MA (blue line), which in my opinion is the critical support, lies around 1206. And the huge support is the 200 week MA(yellow line) , around 1160. Note that 200 week MA is still sloping downwards. To the upside 200 day MA is around 1285 which will act as a strong resistance.And next is the 50 day MA around 1306 at the moment.


I was stopped on my small long position in eur/chf when it made a new low around 1.147. But as I was still on vacation at the time, unfortunately missed to sell 20 day MA on 22 nd of July at 1.189 .Well it had a strong down run from that level to 1.0795 today. But as you can see in the daily chart below, it bounced strongly after swiss central bank announced they will take actions against a strong franc. Well , 20 day MA shorting is still a good game, the markets can easily make a big bounce. It is around 1.15 which also intersects with the break of the down channel.I will try to long close to the low around 1.08 with a tight stop in case it goes down those levels again.

Friday, July 15, 2011

15/07/2011 Market review

Sp future is trading around 1304 at the moment. It has been a very volatile month in most of the asset classes I have been following.

You can see from daily sp index graph that the market holded on the 200 day ma(yellow line) as the support for a rally till 1350 and then we had the pull back back to 20 day ma (green line)around 1306. What next? Well I will be going to holidays and honestly I am mostly on the sidelines at the moment.
Below is the sp index daily graph:


Below is the eur/chf daily graph. In my previous update, I said 20 day ma around 1.21 was a good point to try a short position. Well , there was a squeeze till 1.23, 50 day ma(orange line), I got out around 1.215 with a small loss and then the italian worries hit the maket which triggered a sell off till 1.15. The market is trading on the lower side of the trend channel. ,.On the other hand , i would definetly play shorting the ma20 when it hits that level again.


The wheat was the bad trade for me this month. I got squeezed to the down side. As I mentioned last month ,I bought around 610 on average ( i use the generic wheat index), but there was a 10% down gap day from 640 to 575, where i had to stop with a loss.Then the market recovered around 20%. Below is the daily graph for the generic wheat index.


Last month trades I was looking for:

wheat: Buy slowly when if it makes a new low below 664. Stop is around 590, so dont get squeezed to the downside. The chart formation is crucial so better wait till 600 to buy if you are not sure about reversal patterns.(674 now)
did not work.
Market made new lows the following week as expected, so I got in on average 610 but got stopped around 575 with a one day 10% drop after bouncing back to 640.

eur/chf: Sell around 1.24 if it bounces with a stop 1.25.(1.204 now)
with update ,sell around 1.21 with a stop 1.215
did not work
Stopped at 1.215

This month:

Buy eur/chf now(1.156 at the moment)
:with a strict stop 1.149. basically when it makes a new low get out. Target is 20 day MA, around 1.195.
I am in the trade with a very little position as I will be on vacation.

Short Eur/chf on ma20 with a tight stop: MA 20 sits around 1.195 at the moment.

Thursday, June 30, 2011

Eur/Chf update

EUr/CHf bounced back to its 20 day MA around 1.2091 which has been acting as a resistance since mid April. It is a good point to try going short with a tight stop. I already added some short term position here with a gradual exit after 1.215.Check the daily graph:

Wednesday, June 22, 2011

Update: Wheat and coffee

Coffee broke down through 253 and trading around 243.75 as warned in my previous post.

Wheat made a new low this week , and I got in around 660 but got out around 647 yesterday when it broke that low stongly with a sell of till 617 and bouncing back from the support till 631.See the daily graph below:


Below is the weekly graph of wheat:


I will wait for that support to be retested around 617 and start buying in slowly with the ultimate support around 590.It might not see those levels again, but in that case its better to see how the weekly graph will look like before entering a long position.
In case 590 is broken decisively to the downside, it can go all the way to 520, then to 400 so the stops should be executed with discipline.

Friday, June 17, 2011

17/06/2011 Market review

Well , i dont think that this down move caught anybody by surprise. Last expiration , the index was around 1343 and at the moment it is trading around 1265.

The first support is around 1249, the low in March. The next support is 50 week MA around 1231(orange line). The support for the bull market as i see it, is the 80 week MA lies around 1190.(blue line). The market might bounce to test the 20 week Ma around 1319.


Eur/chf made new lows. Well still keeping my long term short position.


Check the vix graph below. It closed 22.73 yesterday, 3 month high.


Coffee went up and down, overall not stopped but got out around 265 when i lost my belief in the trade. It looks more likely that it will break 253 to the downside than go up.The graph is below:


There was an opportunity to get into short natural gas around 4.82, made some money on it.Target to buy it back around 4.25.Below is the graph:


Wheat is building up a buying opportuniy i believe. Next week , i will wait for a new low and buy into it with a stop around 590.The graph is below:


I made some money on my 1 by 4 put ratio, eur/chf short and natural gas. Got out almost even money from the coffee trade.Still keeping all my trades and as i mentioned i am watching wheat to buy into.

Last month I called for following trades:
Vix: buy if goes to 14.5 with stop 14, (15.5 at the moment). Couldnt buy , missed opportunity, was fooled by the market previous month when i buyed in around 16 and lost little money.

Coffee: Buy with stop 253 (266 at the moment) Went up and down, depends on how traded. I recommend to get out of the position.

This month trades I am looking for:

wheat: Buy slowly when if it makes a new low below 664. Stop is around 590, so dont get squeezed to the downside. The chart formation is crucial so better wait till 600 to buy if you are not sure about reversal patterns.(674 now)

eur/chf: Sell around 1.24 if it bounces with a stop 1.25.(1.204 now)