
The next support, 50 day Ma (orange line) sits around 1238 at the moment and the market shows some signs of exhaustion which is expected. The upride since the end of november has been more than an end year rally supported by better than expected earning reports lately.
In the weekly chart ,there is nothinng significant to see at the moment. The rebound in the market at the end of the week saved the technical picture here. The 20 week support is around 1206 which is not that relevant at the moment.
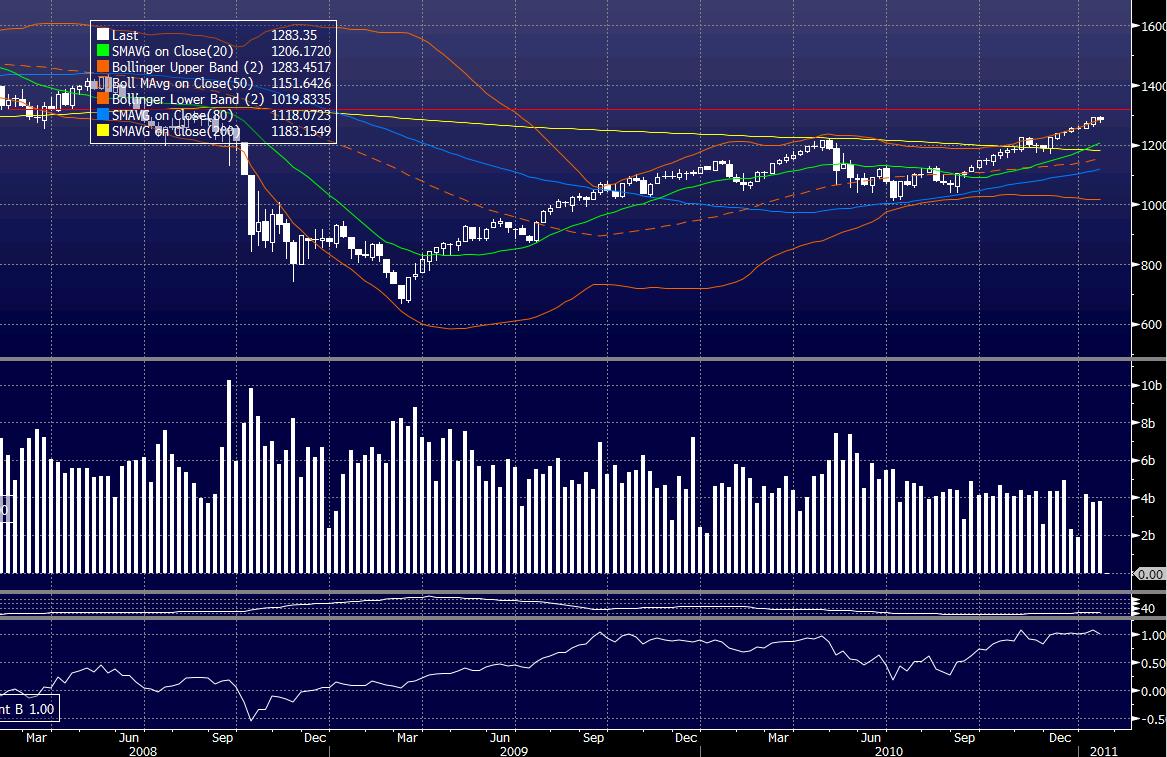
There is one thing very interesting in the monthly chart. Look at the trend channels from 2007 high to 2009 low matching with 2000 high to 2002-2003 lows.January'11 is not over yet.

At these levels I am slightly bearish in the market, long the VIX turbo, short the dow future a little bit. But ready to take my losses in case the markets extends higher.
No comments:
Post a Comment