Sp future indicates index levels around 1306, 11 points higher than the after hours low.The markets in Europe have been edging lower during the past weeks but sp was holding above 1340 level. This week that support is broken and hence the strong selling in the past few days took the market lower.
Below is the daily sp index chart. The white trend line is broken at the matching point of previous significant high around 1370, and the selling accelerated.To the downside the major supports are 1293-1300 range, and below those is the 200 day Ma around 1278(yellow line).Upside, 1340 is now the first resistance, then 1370, and higher than that is the latest high around 1422.
In the weekly chart below you can see that 20 week MA is broken and 50 week and 80 week Ma's are the next supports ,1282 and 1286 namely.To the upside 20 week Ma is at the moment around 1257.
One thing to mention, gold is around 6 %lower compared to past month so, in real dollar terms sp index is still around the 1 year highs. I believe this shows that the markets are not in a panic mode yet , but the macro economic fundamentals are adjusting themselves to the current conditions.Still if you look at the chart below which is the weekly sp/gold chart, there are few reversal candles in place, but the index has a support of 20 week MA which is very close to current levels.
However, in Europe the story is different. The policymakers havent responded yet to the markets' demand for some relief concerning the debt crisis, and Greece is not helping the situation as well. The famous "Sell in May , Go Away!" slogan is definitely putting some pressure on the markets too.
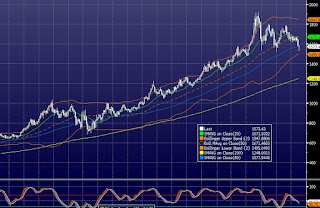
Below is the gold daily chart: There is an assymetrical triangle formation in the daily chart with many of the major mid term support averages broken down. I got some long position around these levels for the long term again. But would not be surprised if the Gold would go further down as will be shown in the next graphs.
Below is the weekly chart of the gold. The 20 week Ma(green line) is acting as a resistance together with the 50 week MA(orange line) since both has been broken for the first time since late 2008.At that time the market had not started the big rally in the past 3 years, but still the market bounced close to 200 week MA(yellow line), which stands around 1248 at the moment.
Now if we check the gold graph in the monthly chart below, you can see the correction in 2008 bounced from the 50 month Ma(orange line) which stands around 1232 at the moment. In the monthly chart , the bull run of the gold is more obvious, and I think it is quite likely that the market to make new lows below 1520 , break the triangle in the daily chart to the downside, but bounce somewhere above 200 week/50 month MA.
All these being said, as mentioned before, I opened a small long position into Gold, keeping in mind a possible big down move, and adjusting my size accordingly. It looks like Gold is waiting for QE3 from US for the next leg up, together with a panic in financial markets .
Concerning the stock market, I would consider a bounce to the upside as a shorting opportunity, and to get long I am waiting for some sort of action to relax the uncertainty in the credit markets in Europe.


No comments:
Post a Comment