Below is the daily sp index chart. As you can see the market bounced slightly below the 200 day MA(yellow line).
To see the complete market action, most of the time it is useful to look at the daily sp future chart as it trades continuously except weekends.When the news came about the Spanish bailout over the weekend, the future spiked to 1349 , then fell till 1306 on Monday the 11th of June,eventually bouncing from 1303.5. You can see that the spike took the market up to 50 day MA(orange line), failed to hold at that level and bounced back again from 20 day MA(green line).
Below is the weekly chart of sp500.50 week MA(orange line) is where the market found support.
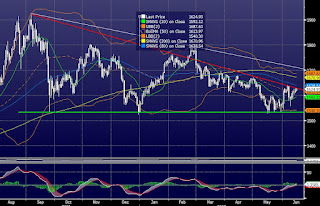
And finally lets check the daily Gold graph.The triangle formation is still in action.The market is testing the upper leg. Even if that leg is broken, there are significant resistances above ,namely 1670 and 1700.It looks like that the market is waiting for the realization of quantitative easing of some sort, or a real panic in the markets to make new highs.Nevertheless, small long position there.
The Greek elections this weekend has been bothering the markets together with the rising Spanish and Italian bond yields. Worse than expected macro economic data from US is adding to the pressure. Despite all these, it looks like the increasing expectation of a quantitative easing 3, or a similar action from FED and the belief that the European politicians will do whatever necessary to support the Euro is keeping the markets relatively strong.


No comments:
Post a Comment