Showing posts with label US. Show all posts

Friday, May 20, 2011

20/05/2011 Market review

On april expiration sp index was around 1309.We had a volatile month but sp managed to go up to 1343.60 as of yesterday's close. The futures are almost unchanged for the day. We have experienced huge sell off in commodities especially in silver which put pressure on the equities together with Greek debt restructring issues and worse than expected US figures, but I must say the market is holding quite strong.First lets check what happened and then go on with trading ideas.

Below the daily graph:


There is nothing much to note , except that sp is testing the 20 day MA (green line) .

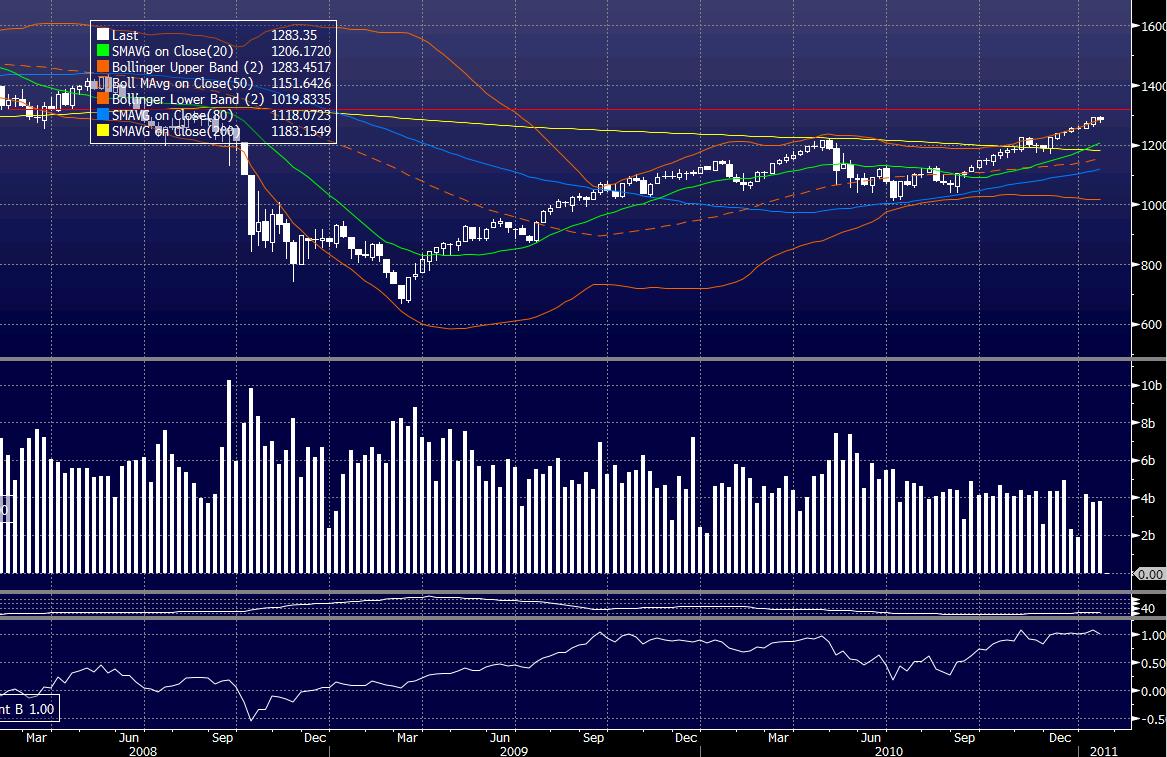
Check the weekly graph:


See how 20 week Ma( green line) has been the support for since sep 2010. The up trend is still in action.80 week MA(blue line), is still around 1180, which i believe marks the support for the bull market.

Eurchf is close to the lows, i still keep my small position, and waiting a bounce around 1.31s to add to my short position(50 week Ma,orange line). below is the graph:


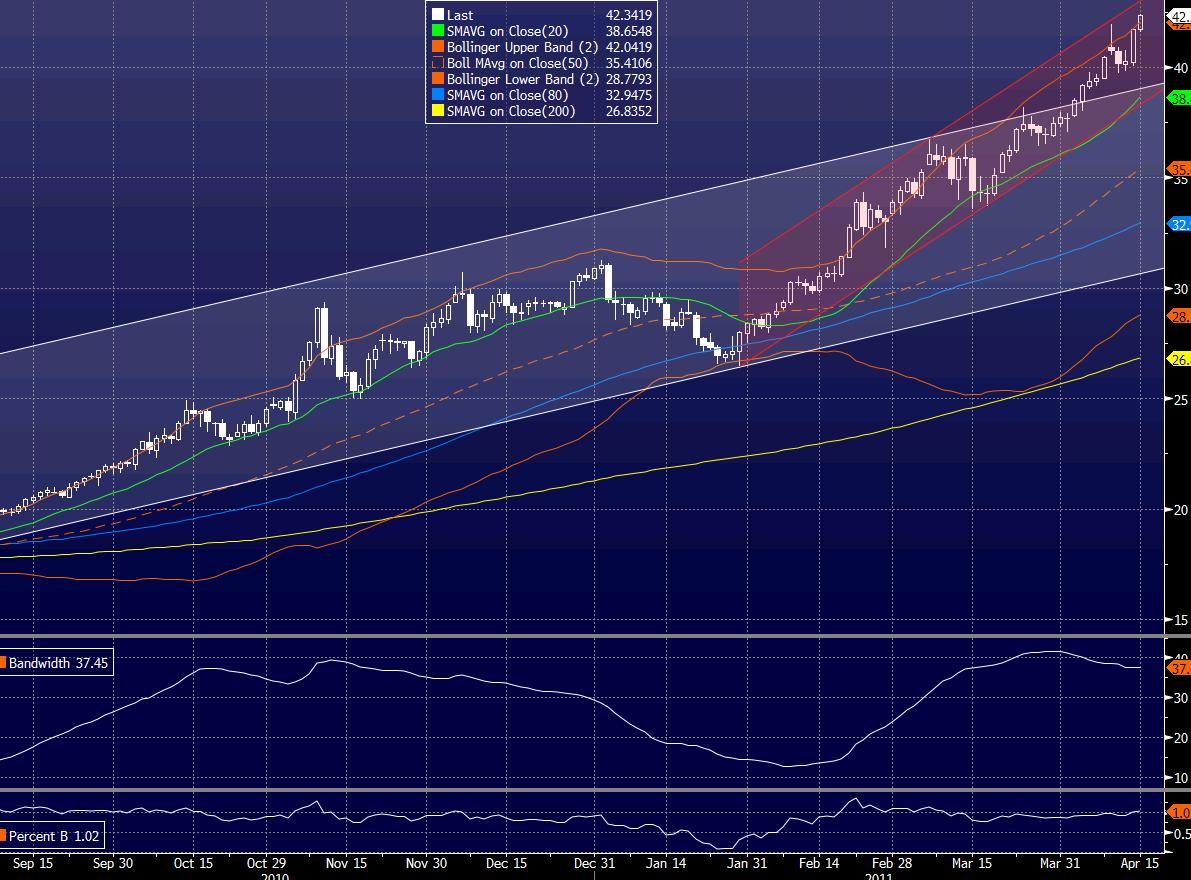
Silver was hammered the most during the commodity crash, and I got out around 40s as I thought the magnitude of the down moves were unusual for a regular pullback. I tried to get long around 37 as i mentioned in the last month's post , but didnt work, so as planned I got out with a small loss around 36, and now I have no position in silver , waiting for the market to stabilize. ANother leg down to 26-27 is not impossible, and I am waiting for gold to go close to 200 day MA's to buy into silver /gold. That level is at the moment around 1400 for gold.
Below is the weekly graph for silver:


Vix is back to 15.52 after going up to as much as 18.5.Below is the graph:


Finally, I got into coffee around these levels. 20 week Ma(green line) has been acting as a support for the past year, i think it is worth a try with a stop around 253.(254.05 is the low of big up candle on the previous pullback).Below is the graph:


I dont have any big position any more. As mentioned before, a little short eur vs chf a recently long coffee and 1 by 4 put ratio vs short call in the index in case of a rapid decline.

Last month I called for following trades:
Vix: buy with stop 14.5, (16.27 at the moment)
result: went up to 18.5 , low was around 14.2 was not the best trade.

Silver : neutral, buy around 20 day MA which is around 38.5 now.Stop if it declines more than 2 percent below that level. (41.98 at the moment)
result : get out with little loss

Eur/chf: neutral, sell around 1.32 with stop at 1.33. (1.2907 at the moment)
result: continuously went down, no trade.


This month trades I am looking for:
Vix: buy if goes to 14.5 with stop 14, (15.5 at the moment)

Coffee: Buy with stop 253 (266 at the moment)

Friday, April 15, 2011

15/04/2011 market review

The market rebounded after the Japanese disaster, but is due to a small correction during the past week triggered by the sharp decline of oil from its highs around 113 till 105-106 and followed by concerns in Eurozone sovereign debt issues .

Below check the sp daily june futures. The market bounced from 80 day Moving average yesterday(blue line) and trading around 20 and 50 day MA's.

sp daily chart:


In the weekly chart of sp index, the market is close to test the 20week moving average(green line) around 1292. The following supports are around 1270 , 1250, 1228,1200. To the upside, 1350 level still holds.And if broken the next major resistances are around 1400 and 1430.

sp index weekly chart:


Past month was a difficult month , I was short eur/chf from 1.30 heavily, and the market tested the upward channel , decisevly trading around 1,32s. I increased my position around those levels with serious thinking of a stop level around 1.33, and thanks to the correction in the equities, the market pulled back, and I am mostly out of my position with a little plus, keeping little short for real long term and waiting for shorting the market when it testes the upper channel again.

eur/chf daily chart:


Silver is unstoppable. I sold half of my position around 40 which was my mid term target when i got into the trade, and keeping the rest for the real long term as well, and waiting for a pull back to enter around 20 day MA which is around 38.5. But the most secure entry level is around 20 week MA which is around 31.7. I believe the 20 week MA wont be tested unless there is a big sell of in the market, and 20 day MA entry is a trade with avery high probability of winning.

silver day chart:


Finally, I have been buying into VIX as it gets closer to around 2 year lows, but it has been costing me .

Vix daily chart:


I add a new section to this blog. My trading calls till next expiration.There is not many high probablity trades I see at this moment, but below are my favorite trading opportunities I am looking at.

Vix: buy with stop 14.5, (16.27 at the moment)

Silver : neutral, buy around 20 day MA which is around 38.5 now.Stop if it declines more than 2 percent below that level. (41.98 at the moment)

Eur/chf: neutral, sell around 1.32 with stop at 1.33. (1.2907 at the moment)

Friday, March 18, 2011

18/03/2011 Market review

The Japanese earthquake , tsunami and finally nuclear problems were really shocking during the past week. I feel bad about trading on these events, and I hope they recover soon from this tradegy.

For the markets :
Below check the sp daily june future. It is trading around 1276. The low during the past week in the june future is 1241(index 1249). The market broke below 50 day Ma and found support around 20 week Ma(1268), which is below the spdaily graph.

daily sp june future


weekly sp INDEX


The resistance is 1295/1300 area which marks the region of 20 day and 50 day MA.
The strong supports are, 1220s the previous top, 50 week together with 200 week around 1180 and than the bull market support , 80 week MA around 1150 .

During the past month I made nice money with eurchf which was one of the safe havens during the panic.

Check eur chf weekly:


ALso silver broke up as I expected.It is a nice run so far, I am still long it, but when there is sell off in the equities, the precious metals are hammered too. So today I bought a turbo short aex index for a hedge in case of a disaster.

silver weekly:


Natural gas had a short term(maybe long term?) bottom, which was difficult because I got in around 3.75 and heavily at 3.93 , and then it fell back to 3.8 at some point but bounced back. Sold most of my position around 4.15, and hoping to short it around 4.5 , the very long term down trend.

Natural gas week:


I first lost on cotton short but then short it again around 220 and bought back 187 yesterday. Overall did not make or lose any money but a good experience to learn the market.

cotton day chart:


I lost some money on dax turbo longs as I got in the market around 50 day MAs(7100). Dax went down almost 15% from the high. Was really painful. But overall it was a good month.

dax june future daily:


Till next expiration, good luck !

Friday, February 18, 2011

18/02/2011 market review

S&p is going up, simple. Well to be honest, I dont have the guts to get long at these levels. I am waiting for some sort of a pull back to get in.

Below is the daily chart.


I will be willing to take some position around 50 day MA when the pullback happens. It sits around 1280 now, and 1271 is the level market bounced from the previous pullback.

In the weekly chart below , 20 week Ma will be the first support. It is around 1242 at the moment.And the big support is the 200 week Ma which is almost intersecting with 50 week MA around 1180.


The 2nd red line drawn as the next big resistance in the picture is around 1436.

Well , i expect a European debt story to challenge the markets in the coming month but shorting the market is not the best option. I am long the vix turbo for that matter. I am playing with turbos trading commodities and currencies at the moment.

Cotton is building up a very interesting opportunity to short. Silver might be breaking to the upside for the 2nd leg! Eur/chf looks like continuing the down trend.

Below cotton daily chart


And silver daily chart.


Also check out the eur/chf weekly chart.

Sunday, January 23, 2011

24/01/2011 Market review

Friday was a busy day so I did not have the time to update the blog. S&P index closed at 1283 bouncing from 20 day Ma support(green line)(1272 at the moment) as you can see below.


The next support, 50 day Ma (orange line) sits around 1238 at the moment and the market shows some signs of exhaustion which is expected. The upride since the end of november has been more than an end year rally supported by better than expected earning reports lately.

In the weekly chart ,there is nothinng significant to see at the moment. The rebound in the market at the end of the week saved the technical picture here. The 20 week support is around 1206 which is not that relevant at the moment.


There is one thing very interesting in the monthly chart. Look at the trend channels from 2007 high to 2009 low matching with 2000 high to 2002-2003 lows.January'11 is not over yet.


At these levels I am slightly bearish in the market, long the VIX turbo, short the dow future a little bit. But ready to take my losses in case the markets extends higher.

Friday, December 17, 2010

17/12/2010 market review

Being long worked out pretty good since my last post, and as most of the market paticipants expected, Spanish and Portuguese worries didnt matter that much FOR NOW!

In the daily s&P chart below , you can see that market found support on 50 day MA and moved up during the past month.At the moment,it is having a hard time breaking above 1250, it has been 4 sessions with no direction. The first support is around 1232 and the next one is 1214.6 , the 20 day MA.


In the weekly chart below, you can see the market is well above its 200 week MA(yellow line) and heading for the next resistance (if 1250 is taken of course) , around 1300-1310. It looks obvious to me that market needs some correction back to 1210s some time, but I expect it to be after new year.Famous 80 week MA(blue line) is at 1095 now, which as I mention in every post, is in my opinion the support for the bull market.


Overall, the macro picture is really complicated at the moment. The economic figures in US show improvement finally, the worries in Eurozone are under the carpet for now but 2011 will be though in terms of Portugal and especially Spain. My wild guess for2011 will be that it is going to be at best the copy of 2010.An upride with some violent down moves.

Friday, November 19, 2010

November Market Review 19/11/2010

Yes,since my last post the market moved up to 1228 and then fall back.Luckily I was quick to cover my shorts, and indeed I am long now around these levels with keeping an eye on critical support around 1130-1150.And ultimately around 1080(explained below).

1228 is noted as the 61.8 fibonnaci retracement of the move from 2007 high to 2009 low.

I am a follower of the MA's. 200 week Ma (yellow line in the chart below) was the resistance in April, and this time 200 week MA is broken to the upside and provided support for the down moves we experienced the last 10 days.
See the chart below:


You can also see the 20 week MA crossed the 50 week MA to the upside again, which means it was a false alarm as I suspected. This strengthens the bullish view.

Just keep in mind the 80 week MA (blue line),which I think provides the support for the bull market that is intact since MArch 2009. It sits around 1080.

The daily chart does not tell much except maybe, the down move found support around 50 day MA .


Overall, there is still uncertainty about European Sovereign debt issues but apparently the market still wants to go up. Portugal looks like the next Ireland/Greece, but the it seems that the market will contain it as well. Nevertheless, I will keep very cautious of my long positions in this dangerous market.

Friday, October 15, 2010

October market review 15/10/2010

It is once again expiration friday and time for a market review.S&p index closed at 1173.81 yesterday. The market showed great strength past 5-6 weeks, and although my long awaited sign of 20 week MA crossing 50 week MA to the downside occured last time(and still the case), I was very cautious with being short around 1130s.

20 week MA being below 50 week MA shows that the market is still weak technically ,however bulls proved to overcome any technical weakness lately.I closed most of my short positions but as long as 20 week MA stays below 50 week MA , I will keep my final shorts.

During the past month, market broke the big resistance at 1130 and moved above 1150 as well. The only resistances left before the year high 1217 is around 1170(before flash crash), and the 200 week MA which sits at 1196 which provided the resistance to the year high at the time.You can check it below in the sp weekly graph.


For support levels , look at the sp daily graph below.Of course 1150 is the first level with 20 day MA,famous 1130 and 200 day MA 1120 are the next levels to watch.
50 day will cross 200 day MA to the upside pretty soon if things wont change dramatically.Thus, the death cross will be just another false alarm.


Gold is going up without a brake, and dollar is in a free fall against other currencies. Euro/dollar trading around 1.41. It will be interesting to see the reaction of the market when quantitative easing 2 is announced. The market proved to be strong , which I think not because of the fundamentals, but rather due to inflation of prices everywhere.I still believe it is a very fragile market, we will see.

Friday, September 17, 2010

17/09/2010

The market rebounded and s&p dec future is trading around 1130 at the moment.The market is at the resistance of the range that has been in effect last couple of months.

Below is the daily graph :


Notice that 80 day MA is also below 200 day MA..Here is the weekly graph of s&P:


One extra thing happened since last time, which is 20 week crossing 50 week MA to the downside.I have been saying I am waiting for this pattern to occur for the confirmation of the beginnig of the bear market,but I am more cautious in this market where patterns appear and vanish easily.In the past there had been few cases when the bulls saved this situation and if 1131 does not hold as a resistance, this might be one of those cases.

See how 80 week MA acted as support during the selloffs,apparently that will be the big one to watch in the future.

Coming 4-5 weeks will be very decisive for the mid term direction of the market. I still back the bears below 1131, but we can easily see new highs if this resistance does not hold. So if this resistance is broken, I will immediately cover my shorts.

Whatever the case, the bull market which started on March 2009 got serious damage during the past 4-5 months, and the market will be very fragile even if the situation would be saved for now.

Friday, August 13, 2010

13/08/2010 Market Review

It has been almost a month since my last post.Since then first the market moved further up testing 1130 level for a couple of days in a row.
The bulls seemed to be in control and any weakness was bought into with expectations of a quantitative easing TWO. Euro went up all the way to 1.33s.

It was a painful ride for me as i was short the market from 1080s, and added more short around 1110. On top of that i was short euro from 1.28 and added some more at 1.32.

Well, the FED announcement was taken as a confirmation of bad economic outlook, and together with the bad macro figures from China , the markets took a dive on wednesday.At the same time the dollar rallied against euro.

Technically it made all the sense as the 1130 was the watched level which is marked in the daily chart below.


You can see the market even broke through 50 day MA , but later bought into and today we are trading around 1085.5 in s&p sep future.

In the weekly s&P chart below, you can see the 20 week MA providing a resistance for the last 3 months, but I cant still say this is the beginning of a bear market as long as the 20 week MA breaks the 50 week to the downside.But in case we dont see a big rally here today, the last candle in the weekly chart will form a dark cloud cover with the previous week's up candle, and a STRONG sign of short term trend change!


In the montly s&p chart below, you can see the market rallied from 20 month MA in July after being sold from 50 month MA, but as mentioned in my post in May, in early 2010 the 20 month MA broke 200 month MA to the downside for the first time since 1980s( i could not check before), and it is a significant sign for VERY long term bear market.


In the chart below you can see how the euro rallied till resistance(high of the big down candle) and sold till 20 week MA.It is a though call, but unless the Euro
sovereign debt issues pop up again,it is very likely that Euro will see 1.37-1.39 range.


Overall,the US Retail sales,Michigan confidence figures will show if the S&P bounces from 50 day moving average to test the 20 week MA(1130s)again or further go down to test the July lows.I am with the bears since 1 month.

Friday, July 16, 2010

16/07/2010 Market outlook

I was waiting for 1140 to short but the markets didnt wait for me to return from vacation and sold off from 1131 till 1006 intraday low(till the point where 80 week Moving average sits).

Then we saw an amazing rally up to 1096 in just more than a week time accompanied by a Euro rally.

We have seen bad economic figures , but the first earning reports beat the analyst estimates, so on that side they seem to cancel each other.

Overall in terms of market sentiment, i believe the market is saying to us, "Ok , the European crisis is under control and not as serious as we thought, so where did we stop with the massive liquidity(thanks to the monetary policies) on our hand, lets buy stocks again!!!"

As long as there is no bad news, the bulls seem to have it under control despite the low volume on the up days.

The chart below is the daily S&p , you can see the market is testing 50 day MA, and we have seen the death cross(50 day crossing 200 day MA to the downside) finally. I already shorted the markets on average around 1080.In case 50 days give way I will sell more around 1110 where 200 day MA sits. And if it gives way the last resort for the bears is the 1131, where the previous sell off began.


The second chart is the weekly S&p and 20 week MA has not crossed the 50 week MA so looking at the past, this death cross is not a sure thing yet. The market is around 50 week MA, and the previous sell of started from 20 week MA whic is now around 1127.You can see the market has bounced from 80 week MA.


The third chart is the daily Euro/dollar. It looks like the Euro will test 1.30 very soon and if it breaks,it will go all the way up to 1.35-1.36 where 200 day MA sits. I am already short euro which is not that wise considering the cyclic behaviour of the currencies and the the trading range of 1.20-1.60 but I believe fundamentally Euro will have very difficult times in the coming months.


The final chart is the weekly euro/dollar and you can see the big up candle till the 20 week MA.


It is a very difficult market,one can get squeezed either side. I understand that the market is not responding to macro economic fundamentals as seriously as it has to YET , but rather the market is supported by the easy liquidty provided by the central banks. One thing for sure, the markets cant run away from fundamental realities for a long time, but you dont want to stand in front of a crazy bull as well.You can try to ride the crazy bull but i will rather sit and watch(if I am not with the bears).

Thursday, June 17, 2010

Market outlook 17/06/2010


It has been very volatile since my last post and s&p is back above 1100, trading around 1117 at the moment. As you can see from the daily chart, 20 day MA crossed 200day MA to the downside for the first time since June 2009(when it crossed 200dayMA to the upside), and is the first serious sign of a possible reversal in the mid term bull market.I will try shorting the market around 1140-1150 where 50day MA sits(1141 at the moment)together with the broken trend line. But till something significant appears on the weekly chart(ie.20 week MA crossing 50week MA to the downside),it is too risky to sit short if the market continues to move higher above 1150.

Thursday, May 20, 2010

Technical Analysis 20/05/2010


In the chart right above(daily s&p) you can see that the trend line i drew a while ago is broken.200 day moving average seems to hold s&p around 1102...20 day moving average crossed 50 and approaching 80 day moving average, but still not near to 200 day Ma. The real down trend begins when the 50 day crosses 200 to the downside, but when 20 day crosses 200 , one can still use a rebound to sell because it is a strong sign!

The second chart in the middle ,you can see the weekly graph, and the market rebounded from 50 week MA during the flash crash!Here the picture is also still bullish, first 20 week has to cross 50 week , and the real down trend starts after 50 week crosses 80 week to the downside.

Overall, for the long term , I am still bearish and with the new sovereign debt issues, I am more bearish than ever.But for the medium term, the bulls still have the advantage of the trend, although one should never forget that anything can happen with this much nervousness in the market.

next day edit: On the top you can see the 10 year monthly graph after yesterday's close.Well you can see 50 month MA marked the resistance and actually one can see 20 month MA crossing 200 month MA to the downside which shows a bearish sign for the longer term.This is a significant sign to support my long term bearish idea

Monday, April 19, 2010

Technical outlook 19/April/2010

Above you see the daily chart in s&p, where it tried to break into the upper channel but failed, and bounced from 20 day MA which sits at 1182. If broken, next support will be btw 1133-1140, around the intersection of MA50 and MA80.
The market headed to 1200 faster than I imagined, the uptrend seems to be stronger but I still think once the technicals point to a downtrend (most important being MA 20 crossing MA200 to the downside-death cross!) the market will be more realistic in trems of reflecting fundamentals.

See the weekly chart hitting resistance at 200 week MA.
Overall, the market is still in the uptrend, still any weakness is bought into and it is higly likely to see new highs.I still sit out and wait for a clearly defined situation to be in the market, or to be more clear, to short the market, till then it is a good experience to see how technicals move the market against the fundamentals.

Thursday, February 4, 2010

Technical outlook 04/feb/2010

S&p 3 year weekly graph
red line 50 week moving average
green line 80 week MA
Purple line 200 week MA
Look how the 80 week MA fits perfectly to the graph.It worked as a support on the first sell off in 2007, which broke through the 50 week MA (red line).
Market recovered, made a new high and 80week MA acted as a support once again forming a Head and Shoulder pattern, and when finally it was broken at the beginning of 2008 it acted as a resistance in the mid of 2008, at the exact point it intersected 50 week MA.
In 2009 , first 50 week MA was broken through to the upside in August, then 80 week MA was broken to the upside in september and we are heading to the 200 week MA , purple line which is around 1200 in S&P.
Well, the perfect fit for my long term BEARISH scenario will be, 50 week and 80 week MA intersection acting as a support to a big sell off, (like this one where 50 DAY and 80 DAY MA's are broken to the downside, showing serious signs of weakening trend) and market rebounding to make a new high as in 2007 and then going back down to the old lows and maybe even further.
I will say it is not a miracle if S&P goes all the way down to 1000 where 80 and 50 week MA's are getting ever closer by the time passes.Bounces from there to 1200 where 200 week MA sits.
Goes back down to 920-940, breaking the support of 50&80 week MA.Rebounds to 1000, 50&80 week acts as a resistance and goes all the way down to old lows.
It looks very beautiful and reasonable.

Tuesday, February 2, 2010

02/02/2010

Yes the long awaited pull back came, s&p future bounced 1.5% from the low of the pull back trading around 1088.The long term down trend line is not confirmed to be breaken upwards yet, but it looks like it is gonna be taken by the bulls.

Is it the end or are we going to see lower. Well together with my expectation of dollar strengthening, gold weakening,and market going down, I think this move was for now enough, but for me this is not the real pullback as long as we dont see 1000 or even 920.

This year, better bear mind that a pull back of a big magnitude is high likely. And I still think we will pay a visit to the March 09 lows sooner or later!

Monday, January 18, 2010

18/01/2009 technical review


The pullback.When will it come? We are above the technical downtrendline mentioned in the previous posts but I dont call this a breaking of the trendline yet. Yes, the market is in the uptrend, but I keep some of my position as short for the real long term. This year hopefully wont be a boring year as many argue. The slow recovery etc etc.