Showing posts with label Market Analaysis. Show all posts

Friday, July 16, 2010

16/07/2010 Market outlook

I was waiting for 1140 to short but the markets didnt wait for me to return from vacation and sold off from 1131 till 1006 intraday low(till the point where 80 week Moving average sits).

Then we saw an amazing rally up to 1096 in just more than a week time accompanied by a Euro rally.

We have seen bad economic figures , but the first earning reports beat the analyst estimates, so on that side they seem to cancel each other.

Overall in terms of market sentiment, i believe the market is saying to us, "Ok , the European crisis is under control and not as serious as we thought, so where did we stop with the massive liquidity(thanks to the monetary policies) on our hand, lets buy stocks again!!!"

As long as there is no bad news, the bulls seem to have it under control despite the low volume on the up days.

The chart below is the daily S&p , you can see the market is testing 50 day MA, and we have seen the death cross(50 day crossing 200 day MA to the downside) finally. I already shorted the markets on average around 1080.In case 50 days give way I will sell more around 1110 where 200 day MA sits. And if it gives way the last resort for the bears is the 1131, where the previous sell off began.


The second chart is the weekly S&p and 20 week MA has not crossed the 50 week MA so looking at the past, this death cross is not a sure thing yet. The market is around 50 week MA, and the previous sell of started from 20 week MA whic is now around 1127.You can see the market has bounced from 80 week MA.


The third chart is the daily Euro/dollar. It looks like the Euro will test 1.30 very soon and if it breaks,it will go all the way up to 1.35-1.36 where 200 day MA sits. I am already short euro which is not that wise considering the cyclic behaviour of the currencies and the the trading range of 1.20-1.60 but I believe fundamentally Euro will have very difficult times in the coming months.


The final chart is the weekly euro/dollar and you can see the big up candle till the 20 week MA.


It is a very difficult market,one can get squeezed either side. I understand that the market is not responding to macro economic fundamentals as seriously as it has to YET , but rather the market is supported by the easy liquidty provided by the central banks. One thing for sure, the markets cant run away from fundamental realities for a long time, but you dont want to stand in front of a crazy bull as well.You can try to ride the crazy bull but i will rather sit and watch(if I am not with the bears).

Thursday, June 17, 2010

Market outlook 17/06/2010


It has been very volatile since my last post and s&p is back above 1100, trading around 1117 at the moment. As you can see from the daily chart, 20 day MA crossed 200day MA to the downside for the first time since June 2009(when it crossed 200dayMA to the upside), and is the first serious sign of a possible reversal in the mid term bull market.I will try shorting the market around 1140-1150 where 50day MA sits(1141 at the moment)together with the broken trend line. But till something significant appears on the weekly chart(ie.20 week MA crossing 50week MA to the downside),it is too risky to sit short if the market continues to move higher above 1150.

Thursday, May 20, 2010

Technical Analysis 20/05/2010


In the chart right above(daily s&p) you can see that the trend line i drew a while ago is broken.200 day moving average seems to hold s&p around 1102...20 day moving average crossed 50 and approaching 80 day moving average, but still not near to 200 day Ma. The real down trend begins when the 50 day crosses 200 to the downside, but when 20 day crosses 200 , one can still use a rebound to sell because it is a strong sign!

The second chart in the middle ,you can see the weekly graph, and the market rebounded from 50 week MA during the flash crash!Here the picture is also still bullish, first 20 week has to cross 50 week , and the real down trend starts after 50 week crosses 80 week to the downside.

Overall, for the long term , I am still bearish and with the new sovereign debt issues, I am more bearish than ever.But for the medium term, the bulls still have the advantage of the trend, although one should never forget that anything can happen with this much nervousness in the market.

next day edit: On the top you can see the 10 year monthly graph after yesterday's close.Well you can see 50 month MA marked the resistance and actually one can see 20 month MA crossing 200 month MA to the downside which shows a bearish sign for the longer term.This is a significant sign to support my long term bearish idea

Monday, April 19, 2010

Technical outlook 19/April/2010

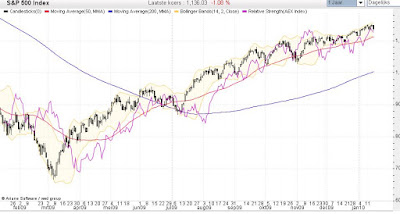
Above you see the daily chart in s&p, where it tried to break into the upper channel but failed, and bounced from 20 day MA which sits at 1182. If broken, next support will be btw 1133-1140, around the intersection of MA50 and MA80.
The market headed to 1200 faster than I imagined, the uptrend seems to be stronger but I still think once the technicals point to a downtrend (most important being MA 20 crossing MA200 to the downside-death cross!) the market will be more realistic in trems of reflecting fundamentals.

See the weekly chart hitting resistance at 200 week MA.
Overall, the market is still in the uptrend, still any weakness is bought into and it is higly likely to see new highs.I still sit out and wait for a clearly defined situation to be in the market, or to be more clear, to short the market, till then it is a good experience to see how technicals move the market against the fundamentals.

Thursday, February 4, 2010

Technical outlook 04/feb/2010

S&p 3 year weekly graph
red line 50 week moving average
green line 80 week MA
Purple line 200 week MA
Look how the 80 week MA fits perfectly to the graph.It worked as a support on the first sell off in 2007, which broke through the 50 week MA (red line).
Market recovered, made a new high and 80week MA acted as a support once again forming a Head and Shoulder pattern, and when finally it was broken at the beginning of 2008 it acted as a resistance in the mid of 2008, at the exact point it intersected 50 week MA.
In 2009 , first 50 week MA was broken through to the upside in August, then 80 week MA was broken to the upside in september and we are heading to the 200 week MA , purple line which is around 1200 in S&P.
Well, the perfect fit for my long term BEARISH scenario will be, 50 week and 80 week MA intersection acting as a support to a big sell off, (like this one where 50 DAY and 80 DAY MA's are broken to the downside, showing serious signs of weakening trend) and market rebounding to make a new high as in 2007 and then going back down to the old lows and maybe even further.
I will say it is not a miracle if S&P goes all the way down to 1000 where 80 and 50 week MA's are getting ever closer by the time passes.Bounces from there to 1200 where 200 week MA sits.
Goes back down to 920-940, breaking the support of 50&80 week MA.Rebounds to 1000, 50&80 week acts as a resistance and goes all the way down to old lows.
It looks very beautiful and reasonable.

Tuesday, February 2, 2010

02/02/2010

Yes the long awaited pull back came, s&p future bounced 1.5% from the low of the pull back trading around 1088.The long term down trend line is not confirmed to be breaken upwards yet, but it looks like it is gonna be taken by the bulls.

Is it the end or are we going to see lower. Well together with my expectation of dollar strengthening, gold weakening,and market going down, I think this move was for now enough, but for me this is not the real pullback as long as we dont see 1000 or even 920.

This year, better bear mind that a pull back of a big magnitude is high likely. And I still think we will pay a visit to the March 09 lows sooner or later!

Monday, January 18, 2010

18/01/2009 technical review


The pullback.When will it come? We are above the technical downtrendline mentioned in the previous posts but I dont call this a breaking of the trendline yet. Yes, the market is in the uptrend, but I keep some of my position as short for the real long term. This year hopefully wont be a boring year as many argue. The slow recovery etc etc.

Sunday, June 7, 2009

08/06/2009 Pre market

08.30 am Amsterdam
Nothing special, all major indices almost unchanged.The huge resistance levels are working fine so far. But the bulls still dominate the game.

Thursday, May 14, 2009

15/05/2009 Pre Market

8.35 am Amsterdam

S&P future is trading around 892. Today, the market will try going up, but I believe the move will be limited. It looks like the market will break 870-880s in the coming days/weeks, and we will see 850-830-800 levels again.

Let me say it like this: I think breaking to the downside is much more probable than breaking the 930-940 resistance levels.